Purpose
Lists examination performance by student and summarizes overall performance on a paper.
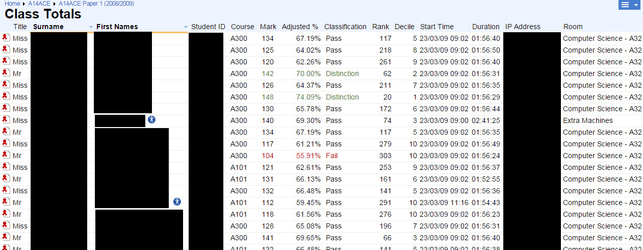
The top portion of the report is a table of each candidate's performance. The bottom portion graphically depicts overall performance.
From the Class Totals report you can drill down to individual student scripts.
Totals Table
Each row displays the following information:
- Title
- First Names (students with accessibility profiles are marked with , notes with a , resits with a )
- Surnames
- Student ID
- Course that student is registered on
- Mark absolute mark
- Adjusted % after monkey marking is applied
- Classification whether the student passed, failed or got a distinction (distinctions are green, fails are red)
- Rank how the student
- Decile
- Start Time
- Duration
- IP Address of the computer used for examination
- Room where exam was sat
Users can sort the table by clicking on a column header.
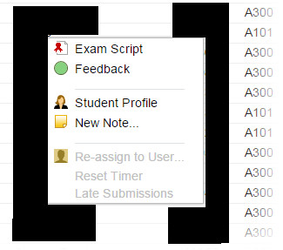
Clicking on a row brings up a popup menu for that student:
The Exam Script menu item drills down to the student's complete Examination Script. Feedback shows to what extent the student has met their learning objectives (assuming they have been mapped). Student Profile shows the related Student Profile screen. New Note allows one to record a note against a student.
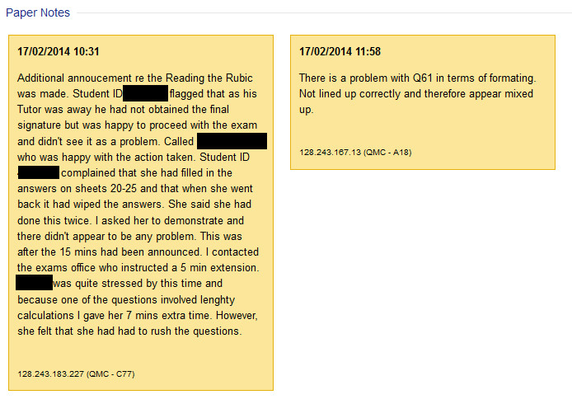
Paper Notes
These record notes made by the invigilators during the exam:
Mid Exam Clarifications
This section records clarifications made by the exams office.
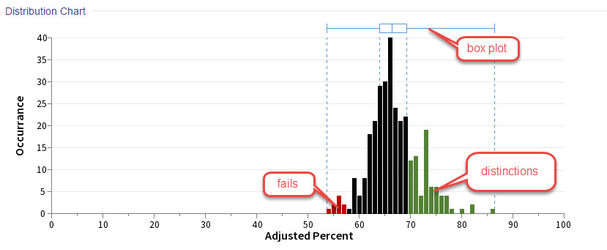
Distribution Chart / Summary
These summarize the overall examination statistics. The report plots the adjusted scores on a histogram augmented with a box-and-whisker plot:
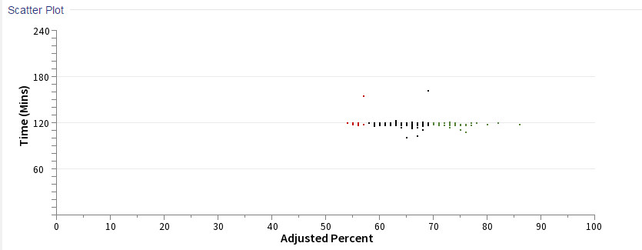
The same score buckets are also used to scatter plot the duration of the examination for individual candidates:
The Summary section gives a full numeric breakdown of the plotted information:
| Summary | Deciles | Quartiles | ||||||||||||||||||||||||||||||||||||||||||||||||||||||||||||||||||||||||
|---|---|---|---|---|---|---|---|---|---|---|---|---|---|---|---|---|---|---|---|---|---|---|---|---|---|---|---|---|---|---|---|---|---|---|---|---|---|---|---|---|---|---|---|---|---|---|---|---|---|---|---|---|---|---|---|---|---|---|---|---|---|---|---|---|---|---|---|---|---|---|---|---|---|---|
|
|
| ||||||||||||||||||||||||||||||||||||||||||||||||||||||||||||||||||||||||
For Progressive and Formative papers only staff can also choose to email students their mark by clicking on the 'Email Class Marks' button. The functionality is similar to a mail merge in that the template uses place holders for the user specific information such as 'student-mark'. An example is given below:
