This space is archived
For current information please use the current ExamSys documentation
Statistics
- Joseph Baxter
Purpose
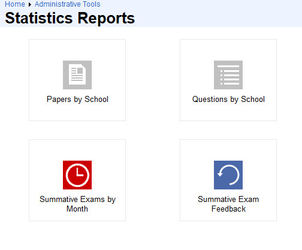
Rogo generates key statistical reports that help to monitor operations. This screen provides direct access to these reports:
All reports follow a tabbed spreadsheet format: the tabs serve to navigate through academic years.
School-based reports
Each tabbed spreadsheet uses school names as the row headers, grouped by faculty.
Summary rows total the statistics by faculty.
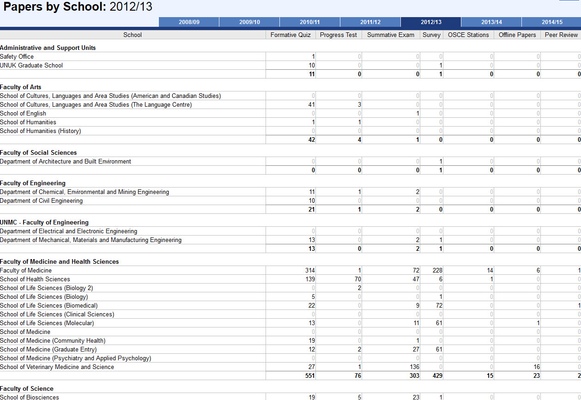
Papers By School
Shows the number of papers of each type for that school in the selected year. Paper types listed are
- Formative Quiz
- Progress Test
- Summative Exam
- Survey
- OSCE Stations
- Offlline Papers
- Peer Review
The following screenshot shows this report, which is a typical report format:
Questions By School
This report totals the number of questions of each type set by schools for a given year. Question types are:
- Dichotomous
- Area
- Calculation
- EMQ
- Fill-in-the-Blank
- Image Hotspot
- Information Block
- Labellinbg
- Likert Scale
- Matrix
- MCQ
- MRQ
- Keyword-based
- Random Block
- Ranking
- SCT
- Textbox
- True/False
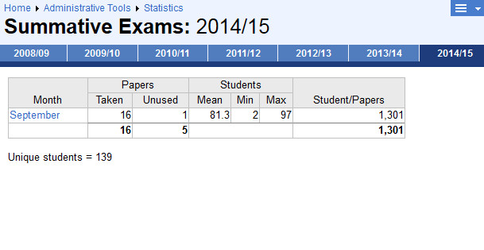
Summative Exams by Month
This is a very simple report that lists how many papers were taken for that month of the year. It also lists the mean, max and minimum of how many students took each paper:
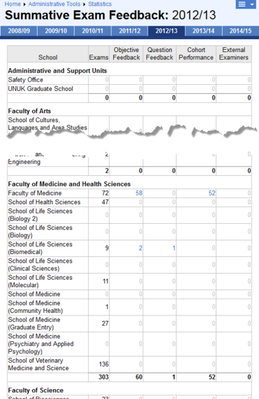
Summative Exam Feedback
This is a school-based report that lists the feedback gathered for exams taken during the year. It lists for each school and faculty the total number of exams, followed by objective feedback, question feedback, cohort performance and external examiner feedback: